Your whole website, scored on 200+ checks and turned into a plan.
Give Auditaar a URL and it audits your whole site across six pillars, with no login or tags to install. You get back a working dashboard, an editable report and a ranked action plan, every finding tied to what it costs you and what fixing it earns back.
200+ live checks, run on your live site at full depth. No account access, ever.
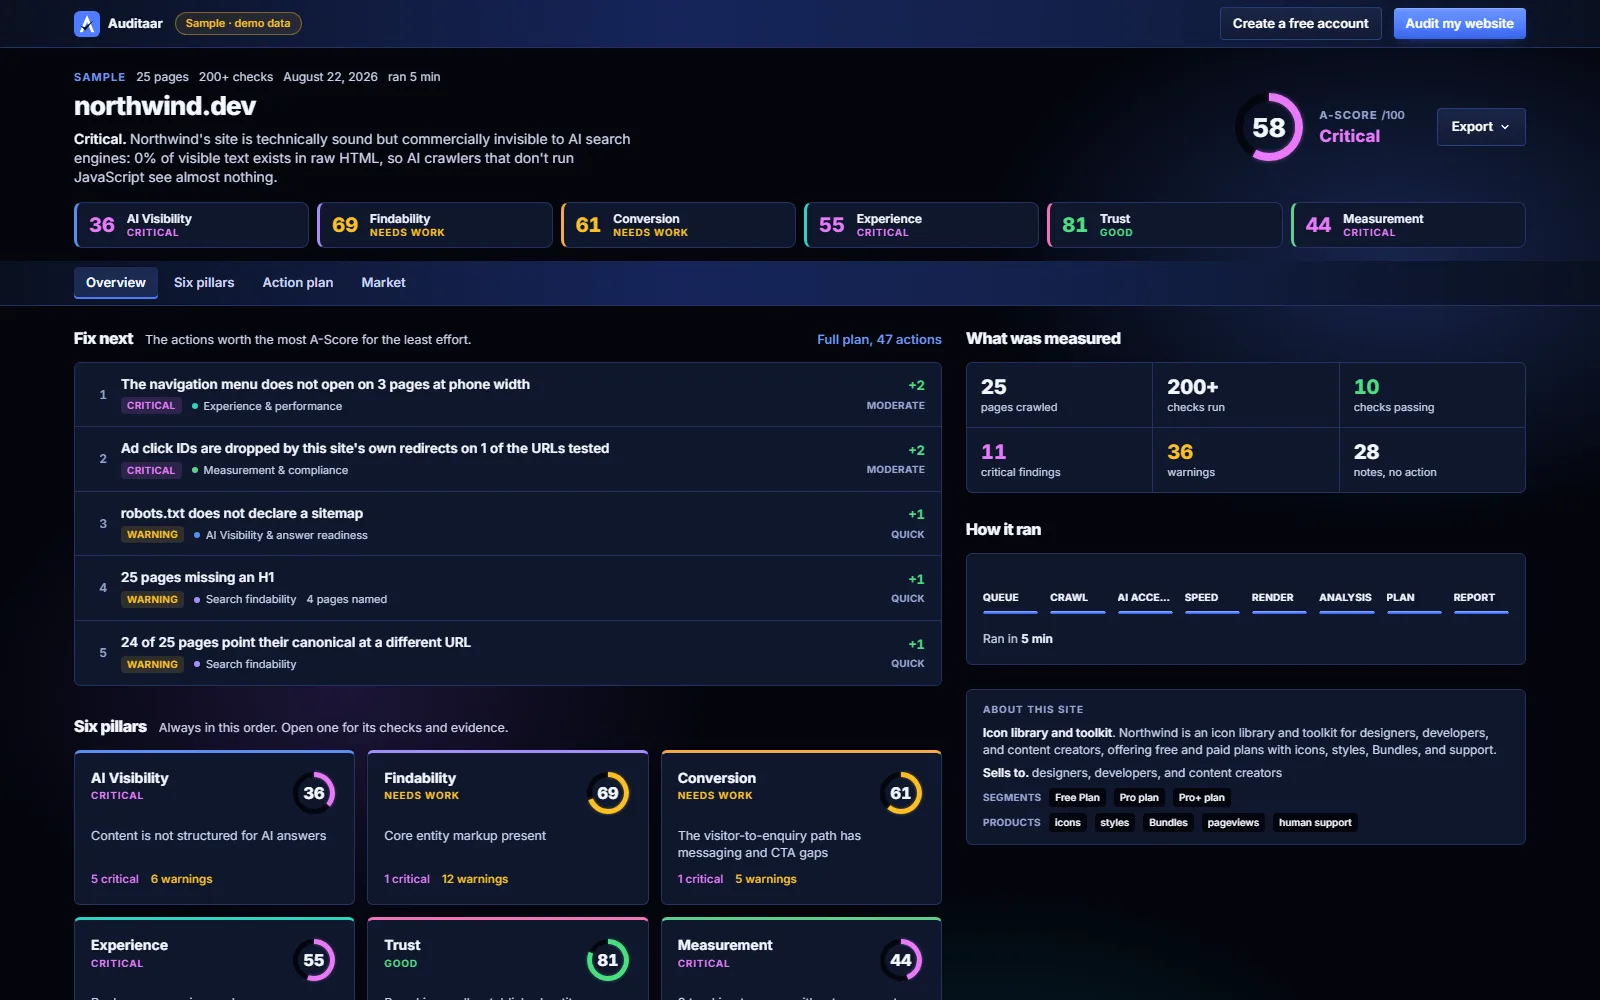
The dashboard you get with every audit. Real output, sample site.
The A-Score: 0 to 100, and you can see every point.
The A-Score is additive: every check owns a slice of 100, so each finding shows exactly how many points it costs you and each fix shows how many it earns back. Under it sit six pillar scores and a severity split, so a glance tells you what needs fixing now and what is already working.
- One headline A-Score out of 100
- Six pillar scores, always led by AI Visibility
- Critical, warnings, info and working, counted and color-coded
Everything that decides whether a customer reaches you, in six pillars.
Each pillar answers one question your customers answer with their attention. The same checks run on every audit, at full depth, and every rate is printed over the pages it measured.
AI Visibility & answer readiness
Can AI assistants find you, and do they cite you when a customer asks?
- Per-agent robots access for 17 named AI crawlers, the confirmed requirement for reaching them
- Optional AI-readiness signals, reported separately: llms.txt, answer-first structure, question headings and FAQ coverage
- What a crawler sees versus a browser, before any JavaScript runs
- How often engines cite you, read from a stored corpus of AI answers, dated in your report
- Google AI Overviews on your own queries
- An AI-Visibility Score out of 100, weighted from the citation and AI-Overview signals above
Search findability & the crawl
Can customers find you in search, and are rivals winning the terms you should own?
- The full crawl: status codes, canonicals, titles, descriptions, H1s
- Thin pages, broken pages and images missing alt text
- Structured data coverage and rich-result eligibility
- Sitemaps, hreflang and the internal link graph
- Click depth, orphan pages and crawl access
Experience & performance
Can visitors actually use the site, on the phone most of them are holding?
- Core Web Vitals from both field and lab data
- What contributes to page load time: page weight, third parties, LCP element
- The site re-rendered at 375px with mobile emulation
- Automated accessibility, page by page, captured in place
Trust, security & brand
Does the site look safe and credible enough for a customer to act?
- HTTPS, TLS, security headers and the content security policy
- A live malware and reputation check against Google's Safe Browsing lists
- Email authentication: SPF, DKIM, DMARC, MTA-STS, BIMI
- Entity signals: Knowledge Graph, Wikidata, Wikipedia presence
- Reviews, social profiles and GitHub open-source authority
Conversion & messaging
Where the funnel leaks: the forms, the message, and the friction before they buy.
- What each form asks for, and where the call to action sits on load
- The overlays that interrupt across a scripted scroll timeline
- Value-proposition clarity and social proof
- Ad-to-landing message match, read from your public Meta and LinkedIn ads
- Funnel coverage across the buyer journey
Measurement & compliance
Can you even see your customers: is your tracking firing, and is it allowed to?
- Analytics and tag detection across the site
- What your container is set to fire versus what actually fired
- Cookies set before any interaction, and consent-platform detection
- Tags firing before a visitor consents
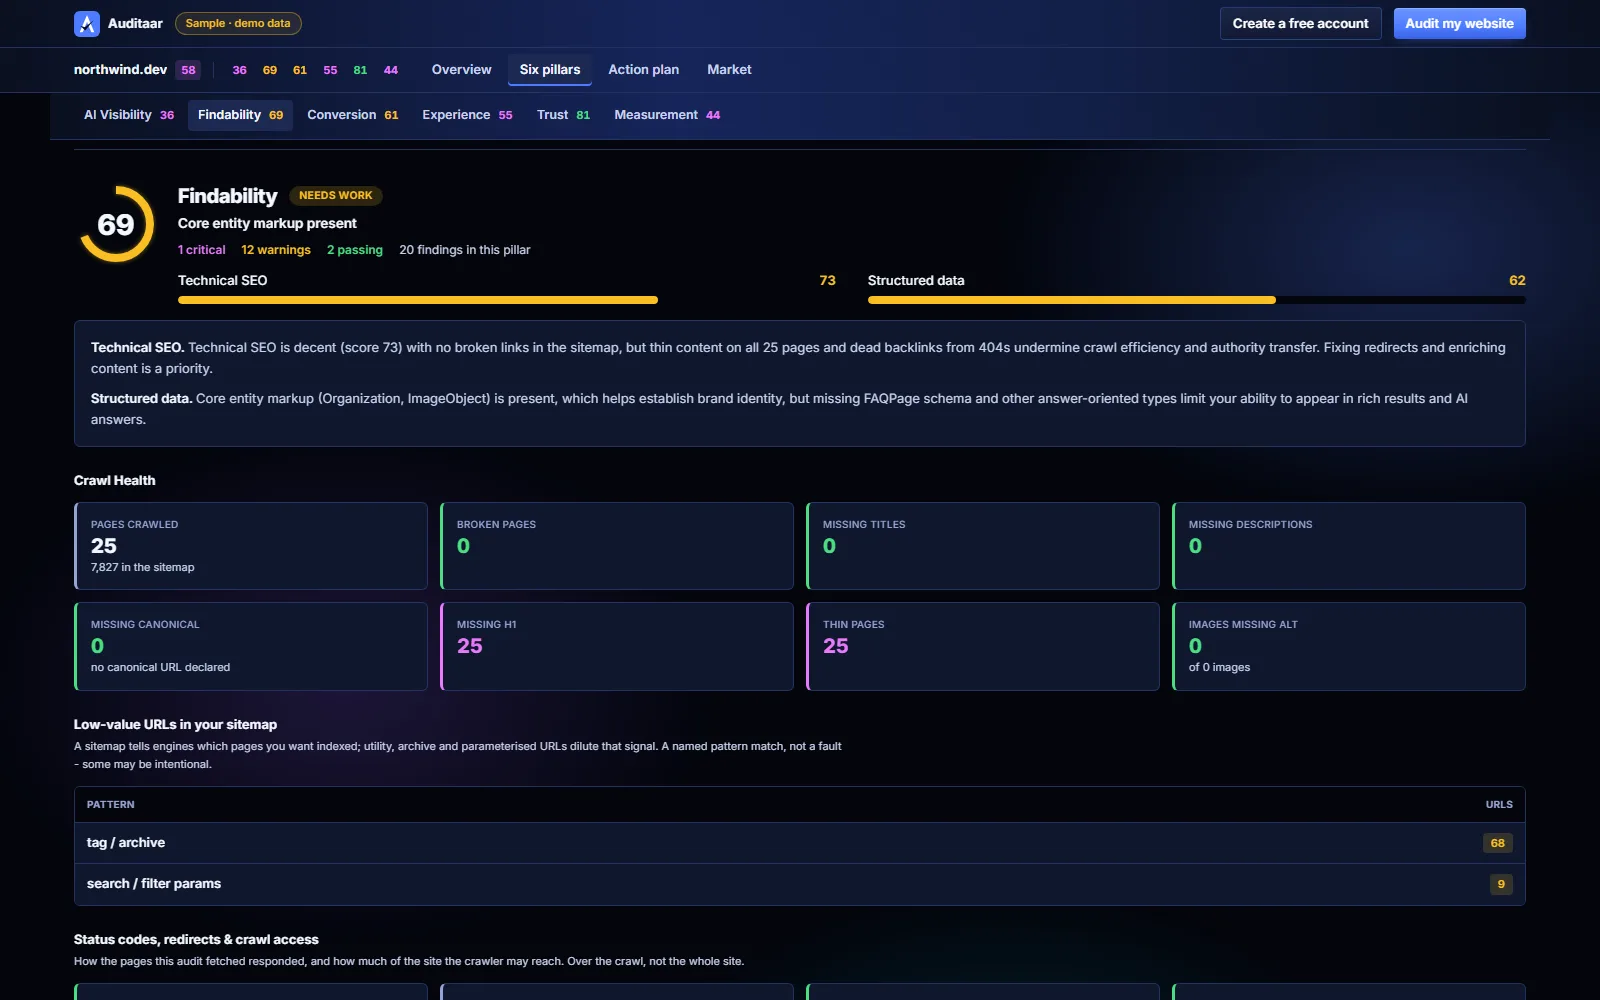
One pillar, up close: sub-scores, crawl health and status codes.
Open a pillar, and every check is there with its score.
Each pillar opens into its own sub-scores, then the raw counts behind them: pages crawled, missing canonicals, images without alt text, status codes, redirect chains.
- Sub-scores that show which part of a pillar is dragging
- Crawl-health tiles: broken pages, thin pages, missing metadata
- Status codes, redirects and crawl access, page by page


An AI-Visibility Score out of 100, and exactly where the points come from.
A single score for how visible you are to answer engines, weighted from measured signals: whether AI actually cites you, whether you appear in Google’s AI Overviews, whether Bing has you indexed, and how often AI names your brand. A signal that could not be measured is withheld from the total, never scored as a zero.
- Weighted from citation, AI-Overview, index and brand-mention signals
- Every signal shown as earned out of its budget, so the score is auditable
- Unmeasured signals drop out of the total rather than dragging it to zero
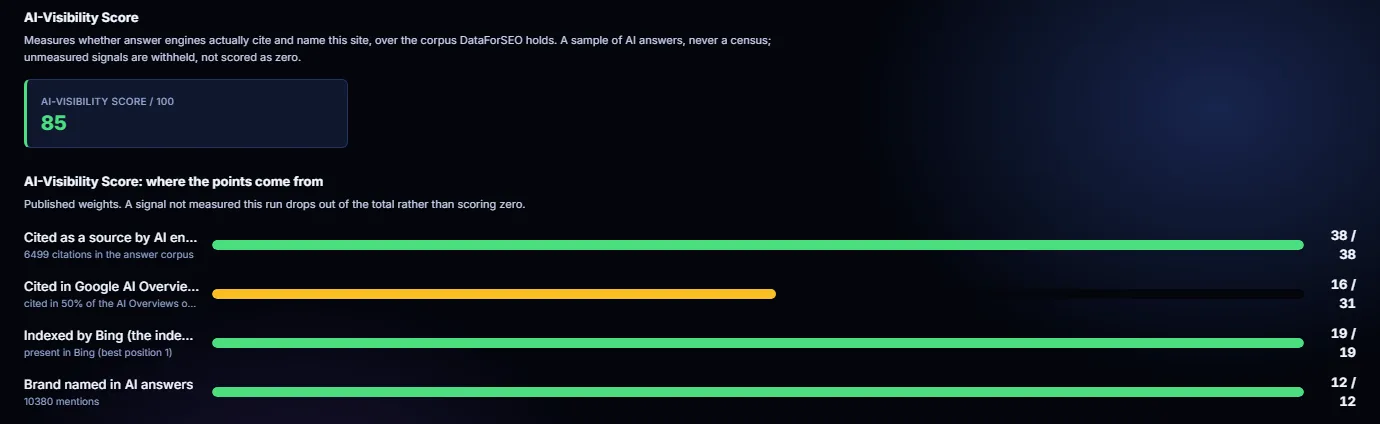
Your AI-Visibility Score and the signals behind it. Real output, sample site.
Every finding, ranked by cost, sequenced into a plan that earns points back.
Findings are ordered by what they cost your business. Quick wins are flagged, the rest is sequenced into phases: access first, then by the effort each fix takes. Complete the plan and the projected A-Score comes from the same weight table that scored you, so you see the score move before the work starts.
- Each fix carries the exact points it earns back (+A-Score, +pillar)
- Phased by access and effort, with a window and a measured target
- A projected score you can take to the person who signs off the work
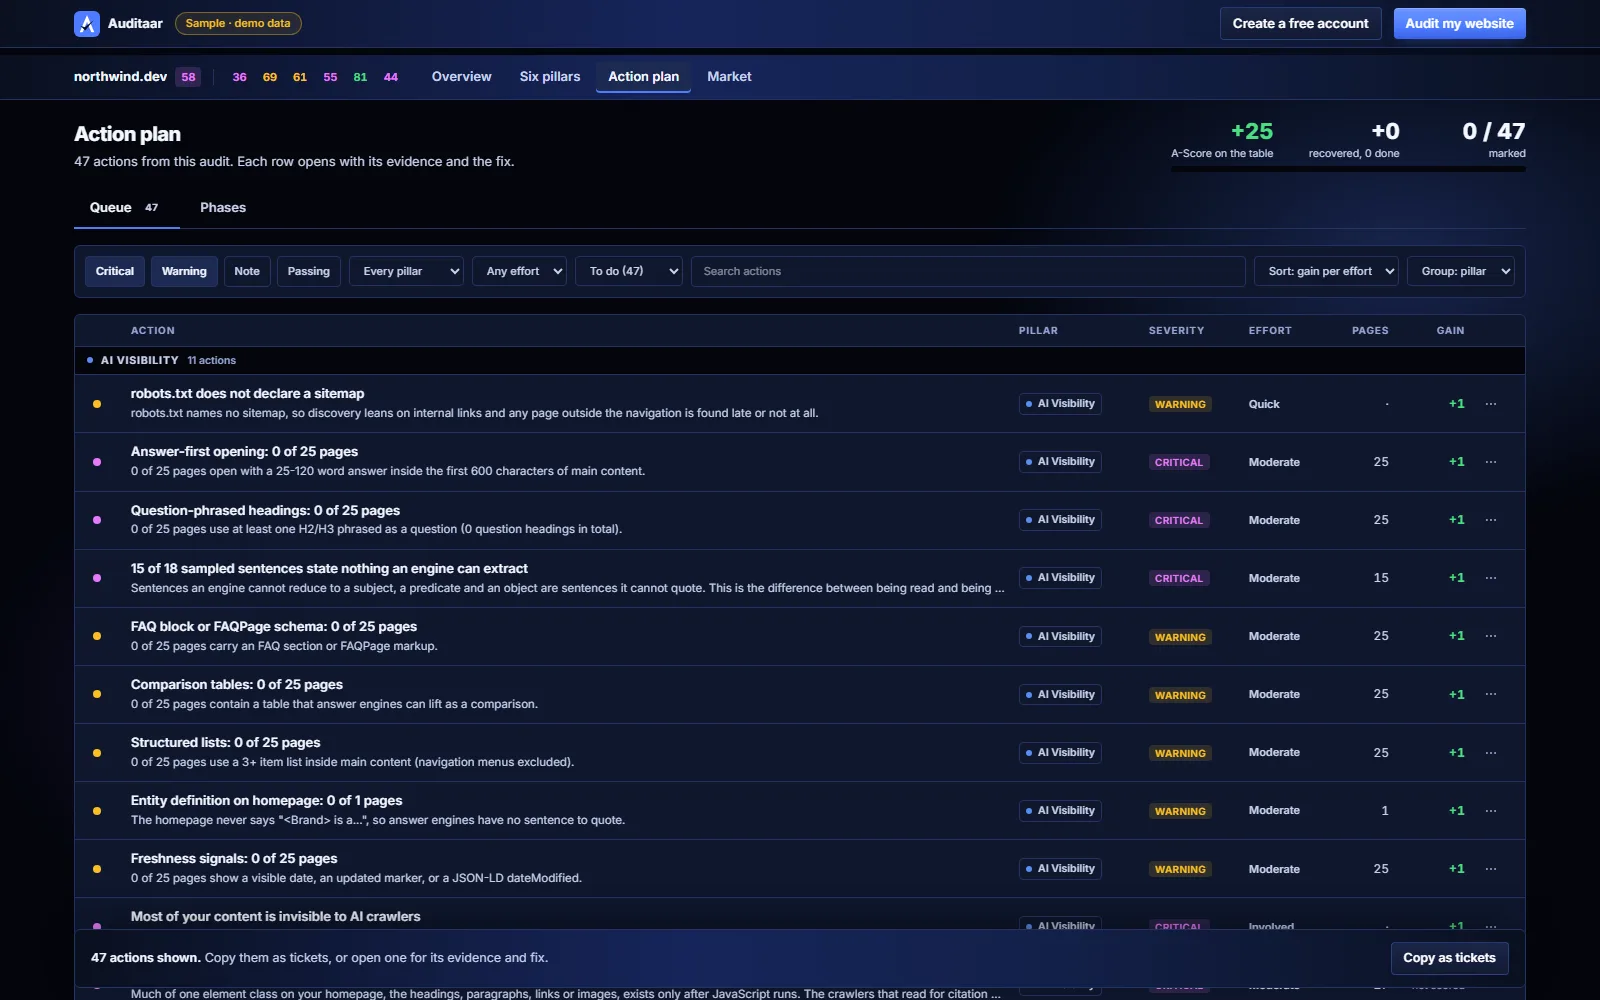
Quick wins first, full plan projected 58 → 83.

Every finding shows the observation, the impact, the fix, and the receipt.
Auditaar screenshots the pages it audits. A finding that says your call to action is below the fold shows you the page with the call to action below the fold.
Trackers fire before anyone consents
−9 A-Score- Why it matters
- Advertising pixels run before a visitor has agreed to anything, the first thing a privacy review flags and a real exposure in regulated markets.
- The fix
- Gate the tags behind your consent platform so nothing fires until a choice is made.
- See it
- The two pages where it happens, linked, with the request log and a screenshot of each.
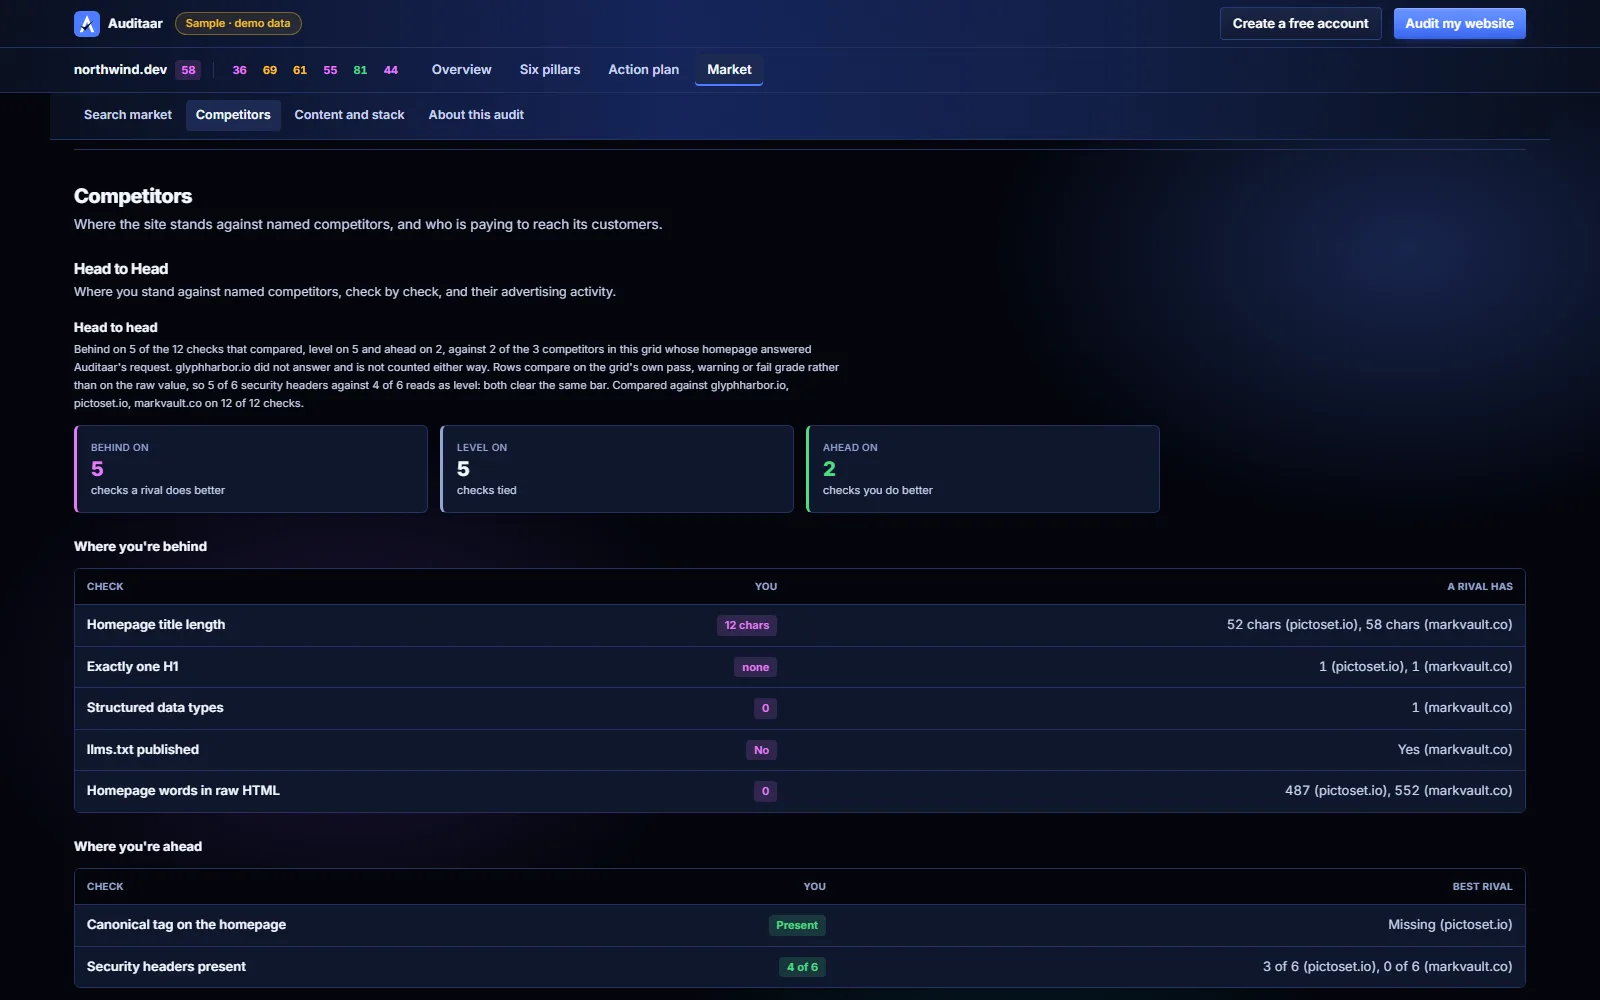
Head to head against named rivals, check by check.
See where you stand against named rivals, and where the demand is.
Beyond the six scored pillars, the Market section reads the market around you: search traffic and authority, rankings and Google AI Overviews, a head-to-head against named competitors check by check, topic gaps, content authority, rich-result features, the tech stack, paid media, and more.
- Behind, level and ahead against each competitor, on the checks that compare
- Keyword gaps, backlink authority and who Google's AI cites instead of you
- An Authority Index out of 100 from the backlink profile, with DataForSEO's domain rank beside it as a cross-check
- Live competitor ad creatives from Meta, LinkedIn, TikTok and Google
A dashboard your team works in, and a report you can hand a client.
Built once from a single source of truth, so the deck you email and the dashboard you filter can never disagree on a score.
Interactive dashboard
100+ visuals across the six pillars. Filter findings by severity, effort, pillar and business impact.
Editable PowerPoint
An on-brand deck, yours to edit and present. It renders a slide only where a check produced data, so it never pads.
Findings spreadsheet
Every finding as a row: priority, severity, effort, module, the fix and the pages affected. Straight into your backlog.
Share link
One link hands the whole audit to a client or a teammate, dashboard and deck together.
From a URL to a scored plan, with nothing to install.
Give it a URL
No login or code to install. Point Auditaar at your own site, or anyone else’s.
It reads the real site
A crawl of up to 250 pages, up to 25 rendered in a real browser, one per template, the way a customer sees them.
Two independent sources
Each fact is read twice: what the site claims, and what actually happens when the page loads.
AI and the market
17 named AI crawlers checked one by one, citations read from a stored AI-answer corpus, competitors and demand mapped around you.
Folded into one score
Everything folds into one A-Score and six pillar scores, each point traceable to the check behind it.
Delivered four ways
Dashboard, editable report, spreadsheet and share link, ranked by cost with a plan to fix it.
Free to start. $499 for the whole picture.
A free Snapshot of your homepage in seconds, a free Diagnostic of the whole site, and the Deep Dive when you want the market, every fix and the plan.
Snapshot
FreeAn instant read of your homepage across all six pillars, in seconds.
- Pages
- Homepage only
- Time
- Seconds
- You get
- The leaks, named, on the spot
Homepage only, no fixes. The Diagnostic covers your whole site.
Diagnostic
FreeA full on-site audit of your whole site: 200+ checks across all six pillars, run under your account.
- Pages
- Up to 60
- Time
- About 10 minutes
- You get
- A-Score and the findings
No market, AI-visibility or competitor data, and findings without the fixes. The Deep Dive adds them.
Deep Dive
$499The complete audit: your market, AI share-of-voice, competitors, every finding with a plan to fix suggested by a team of agents.
- Pages
- Up to 250, 25 rendered in a browser
- Time
- About 35 minutes
- You get
- Every fix, the action plan, dashboard, PowerPoint and CSV
| SnapshotFree | DiagnosticFree | Deep Dive$499 | |
|---|---|---|---|
| Pages read | Homepage only | Up to 60 | Up to 250, 25 rendered in a browser |
| Rendered in a browserone page per template, opened in a real browser | — | A few | Up to 25 |
| Time to result | Seconds | About 10 minutes | About 35 minutes |
| Six-pillar read of the homepage | ✓ | ✓ | ✓ |
| A-Score out of 100the additive score across every check | — | ✓ | ✓ |
| 200+ checks across the whole sitecrawl, AI access, speed, security, email authentication, forms, tracking, consent | — | ✓ | ✓ |
| Findings, namedObservation, impact, recommendation, effort, priority | ◔Homepage leaks only | ✓ | ✓ |
| The fix for every finding | — | — | ✓ |
| Evidence and a fix suggested by the team of agentsone agent per pillar adds the evidence; another agent suggests and validates the resolution | — | — | ✓ |
| Action plan ranked by what each fix earns | — | — | ✓ |
| Head-to-head on twelve homepage checks vs up to 3 competitorsfree checks only | — | ✓ | ✓ |
| Competitors comparedthe free grid on Diagnostic; on Deep Dive the same set also drives keyword gap and AI share of voice | — | Up to 3, free grid | Up to 3, plus paid datasets |
| Market data: keywords, rankings, backlinks, ads | — | — | ✓ |
| AI Visibility: share of voice, citations, AI Overview presence | — | — | ✓ |
| Interactive dashboard | — | ◔Findings; fixes locked | ✓ |
| Editable PowerPoint and CSV export | — | — | ✓ |
| Price | Free | Free | $499, once |

Built for the person who has to act on it.
The dashboard is where the work gets done, the report is what goes to the meeting, and the ranked plan is what everyone follows. Same audit, three shapes, so the findings reach whoever needs them without a specialist in the middle.
See the report before you choose.
Open the sample audit to inspect the evidence, recommendations and action plan, then run Auditaar on your own site.